Highway and Bridge Safety in America: Infrastructure Study (2025)
Federal highways and bridges are crumbling in America, with federal highways receiving a D score in the Infrastructure Report Card and federal bridges receiving a C+. Rhode Island is the state with the worst road conditions, with 38 percent of roads rated poor. Kansas is the state with the best roads, with 84 percent of roads rated good.
Read moreFree Car Insurance Comparison
Compare Quotes From Top Companies and Save
Secured with SHA-256 Encryption
Justin Wright
Licensed Insurance Agent
Justin Wright has been a licensed insurance broker for over 9 years. After graduating from Southeastern Seminary with a Masters in Philosophy, Justin started his career as a professor, teaching Philosophy and Ethics. Later, Justin obtained both his Property & Casualty license and his Life and Health license and began working for State Farm and Allstate. In 2020, Justin began working as an i...
UPDATED: Jul 12, 2024
It’s all about you. We want to help you make the right coverage choices.
Advertiser Disclosure: We strive to help you make confident auto insurance decisions. Comparison shopping should be easy. We are not affiliated with any one auto insurance provider and cannot guarantee quotes from any single provider. Our partnerships don’t influence our content. Our opinions are our own. To compare quotes from many different companies please enter your ZIP code on this page to use the free quote tool. The more quotes you compare, the more chances to save.
Editorial Guidelines: We are a free online resource for anyone interested in learning more about auto insurance. Our goal is to be an objective, third-party resource for everything auto insurance related. We update our site regularly, and all content is reviewed by auto insurance experts.
UPDATED: Jul 12, 2024
It’s all about you. We want to help you make the right coverage choices.
Advertiser Disclosure: We strive to help you make confident auto insurance decisions. Comparison shopping should be easy. We are not affiliated with any one auto insurance provider and cannot guarantee quotes from any single provider. Our partnerships don’t influence our content. Our opinions are our own. To compare quotes from many different companies please enter your ZIP code on this page to use the free quote tool. The more quotes you compare, the more chances to save.
On This Page
Most drivers have accidentally driven into a pothole, bottomed out on a bumpy road, or detoured because of painstaking highway construction. The truth is many of America’s federal highways and bridges are reaching a state of decay, despite the hundreds of billions of dollars spent on repair and reconstruction every year.
As citizens, this potentially concerns not only our taxes and insurance policies but also our safety. For that reason, we decided to take a deep dive into the state of American infrastructure.

We analyzed data from the Federal Highway Administration (FHWA) to examine road and bridge conditions around the country. In the process, we discovered geographic weak spots, trends in funding, and some of the most and least up-to-date American highways. Read on to see where you can drive the most safely — and where you might need to exercise extra caution.
In the case of all these states (except for New Hampshire and Virginia), you’ll need to purchase auto insurance to protect you and the other drivers from major financial damage.
If you live in a state with multiple federal bridges and roads in poor repair and are interested in finding quotes for economical auto insurance right away, just insert your ZIP code into our online quote comparison tool in the box above. By using it, you can see quotes from numerous insurance companies all at once, without going through the hassle of applying individually to each company.
If you want to learn more about auto insurance companies, visit our article about the best insurance companies. By the end of the article, you’ll be an expert on auto insurance and auto insurance companies in 2021.
In this article, we’ll touch on topics a little broader than just highways and bridges in the frequently asked questions section. These include the US infrastructure ranking, whether American infrastructure is good or bad, how to fix America’s infrastructure, and where federal agencies might want to invest in US infrastructure projects.
Let’s dive in.
Assessing America’s Roads
Car safety has dramatically increased in the last few decades, but thousands of people still find themselves in motor vehicle crashes every year. In fact, according to the Insurance Institute for Highway Safety (IIHS), 34,247 fatal car accidents took place in 2017, and it’s safe to assume that roads in disrepair certainly didn’t add to their safety.
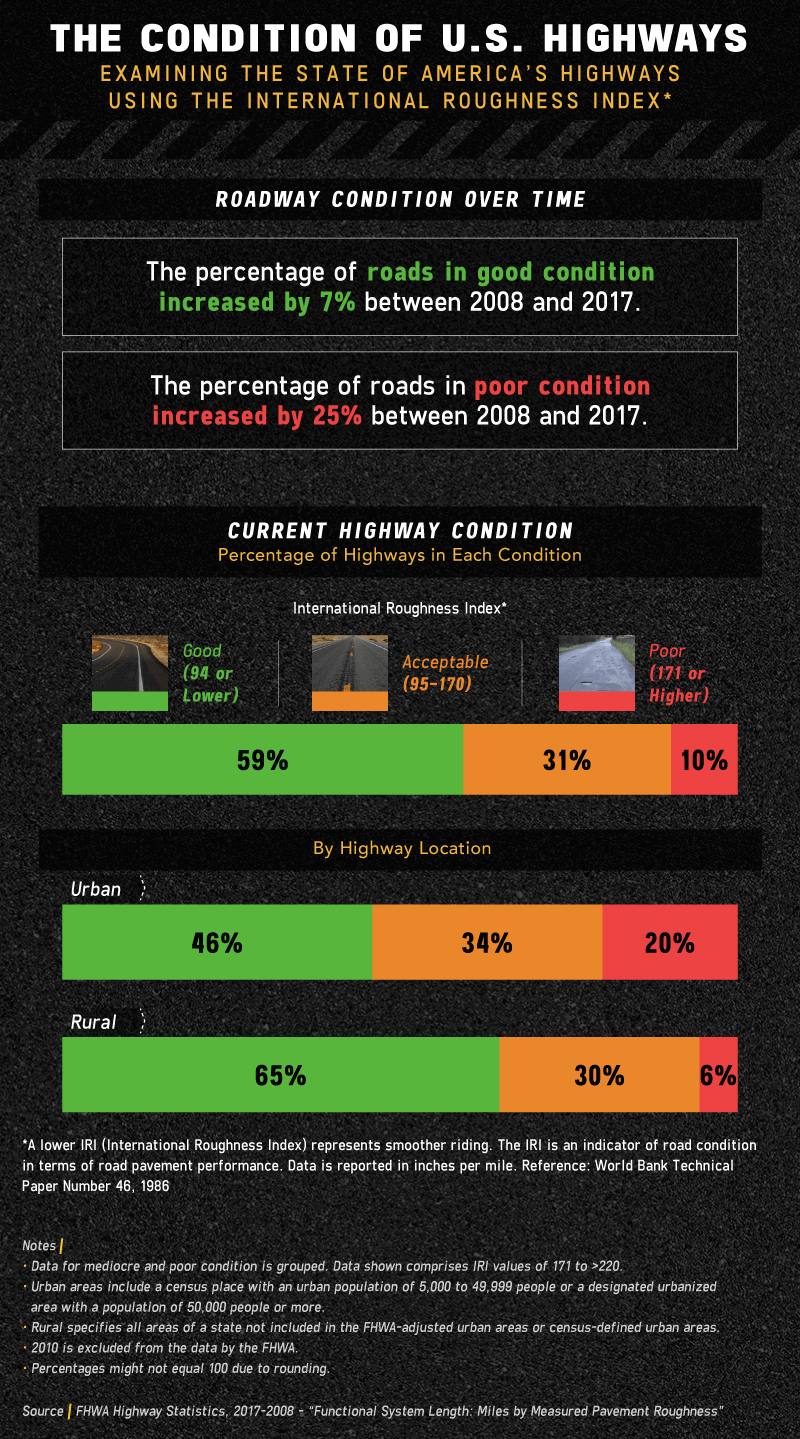
Our researchers examined trends in U.S. highway conditions over time. The percentage of roads in good condition increased by 7% between 2008 and 2017, while the percentage of roads in poor condition simultaneously increased by 25%.
According to the most recent data from the FHWA, less than half of urban roads (46%) were in good condition compared to 65% of rural roads. Urban areas were also the most likely to have roads in poor condition at 20%.
The good news, however, is that highways are mostly in decent shape: Nearly 60% of highways were rated in good condition, while 31% were rated as acceptable.
Free Auto Insurance Comparison
Enter your ZIP code below to view companies that have cheap auto insurance rates.
Secured with SHA-256 Encryption
Health of Federal Highways
Any driver will likely tell you: Not all highways are pleasant, and some areas are notorious for dangerous, bumpy drives. We looked into states with the best and worst highway conditions.
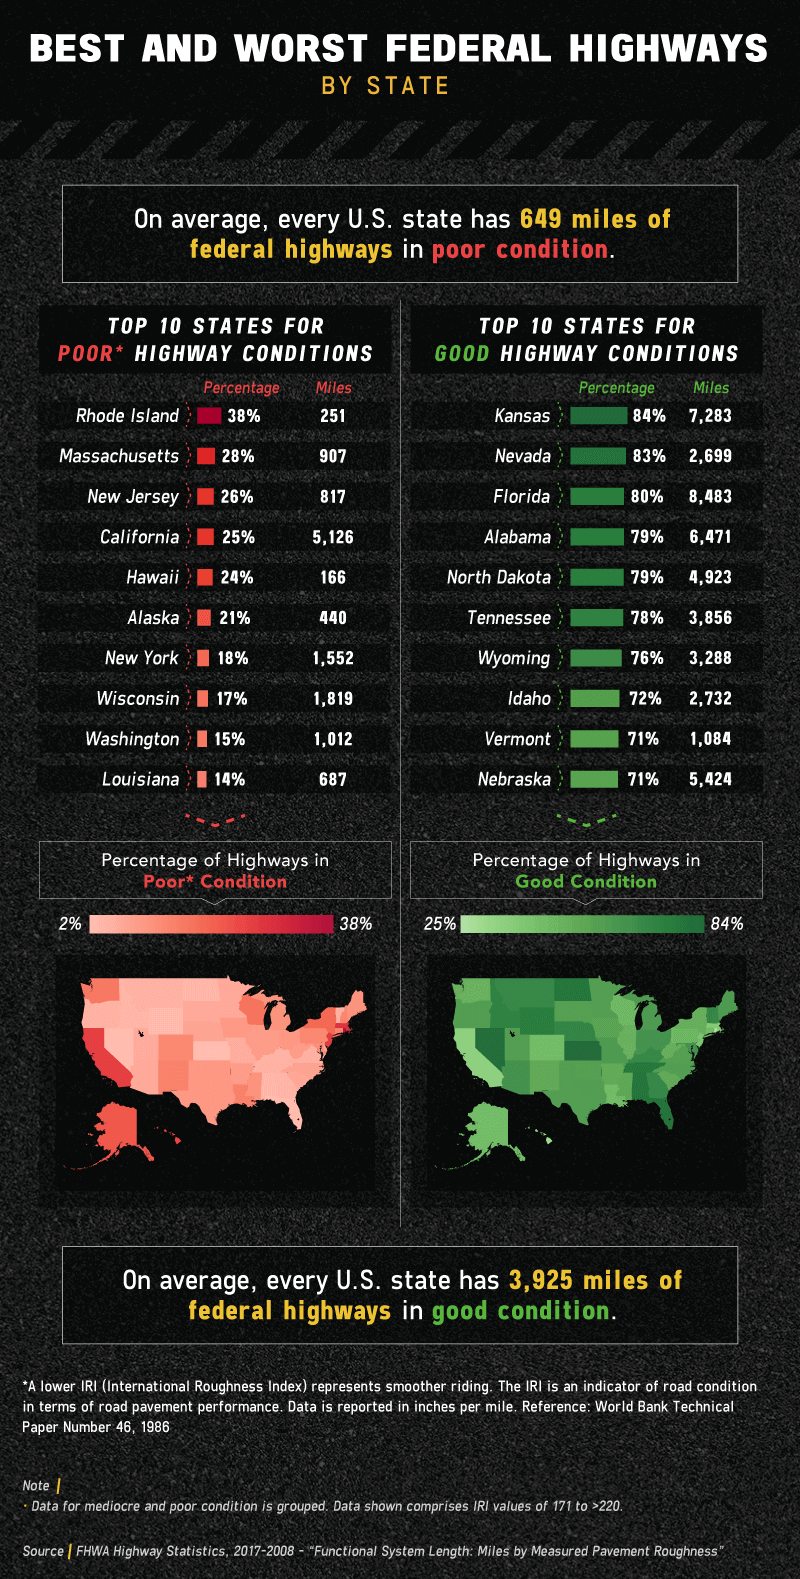
Portions of New England had the worst highways. Rhode Island stood out with 38% of its highways rated as poor. Twenty-eight percent of highways in Massachusetts and 26% of highways in New Jersey were also in poor condition, followed by California, Hawaii, and Alaska.
Meanwhile, the majority of highways in Kansas were in good condition (84%).
Nevada followed at 83%, and then Florida at 80%, with Alabama and North Dakota tied at 79% apiece. Our maps also indicate that much of the Midwest and South have better highway conditions.
Trends in Infrastructure Funding
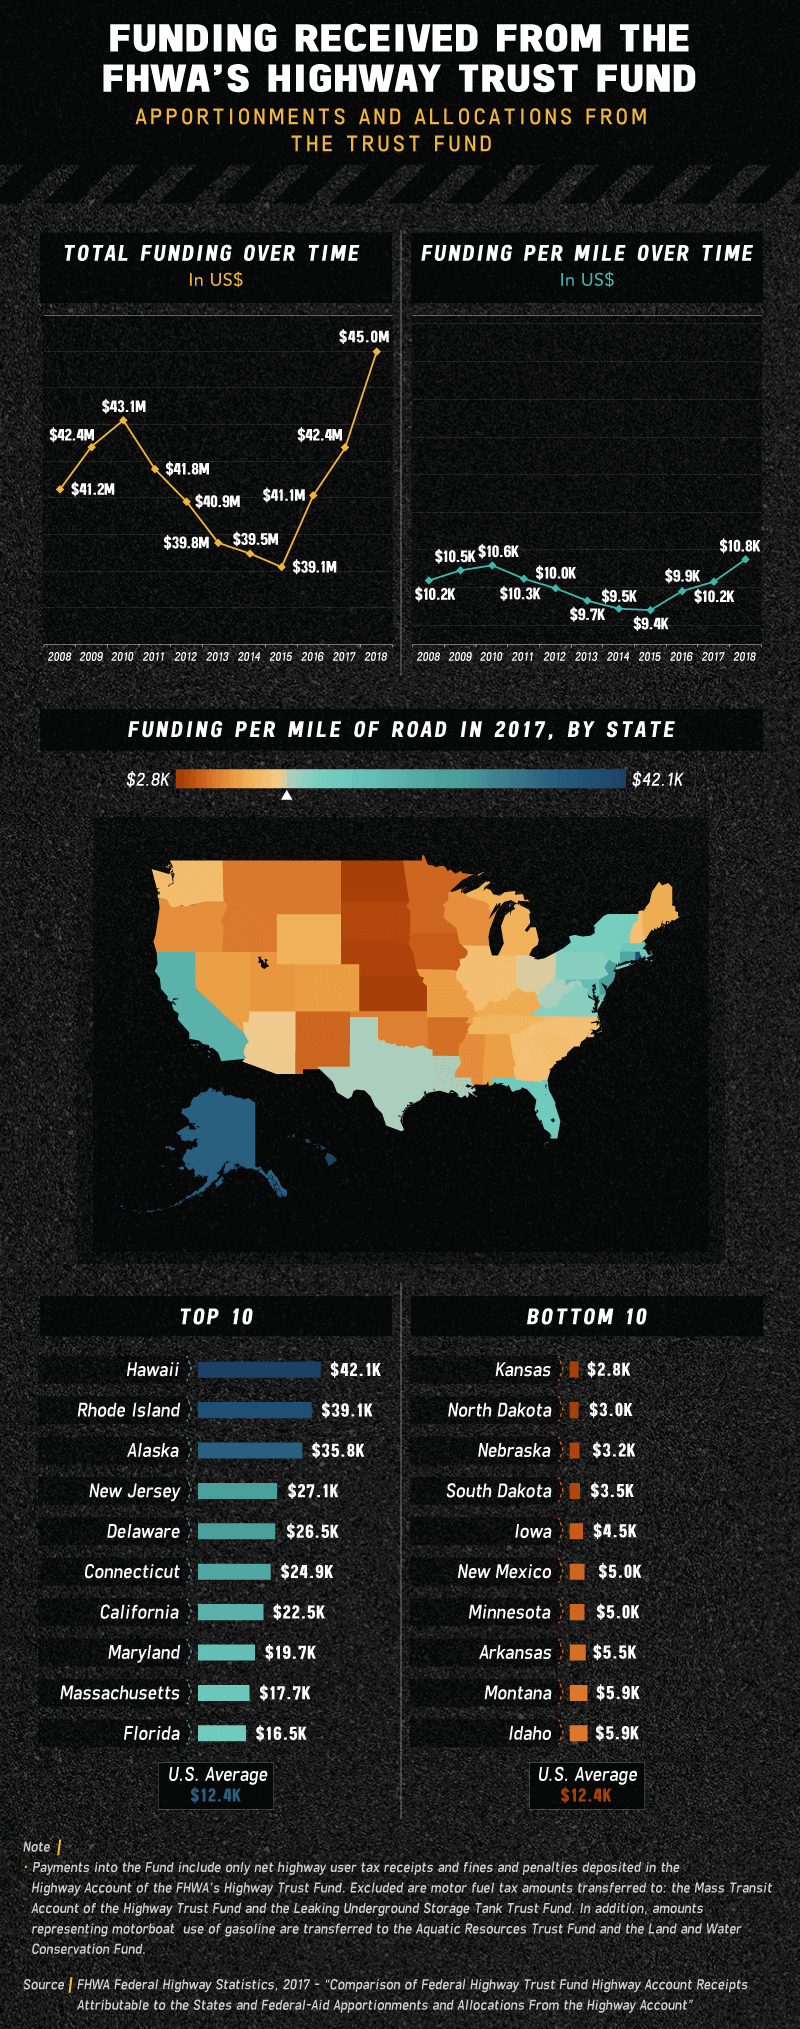
While traffic and weather conditions can certainly affect American roads — which may affect rankings like the best drivers in America — funding might also play a role. Our analysis suggests that total funding for American roads provided by the FHWA’s Highway Trust Fund has dramatically changed over the last decade, but more funding – $45 million – was funneled toward roads in 2018 than in the previous 10 years.
There was a five-year period of decreased funding starting in 2011, with 2015 being the least-funded year at $39.1 million. Funding per mile of roads also declined during this period, although it also stood at a 10-year high in 2018 at around $10,800 per mile. Also, the amount of funding significantly varied depending on the region.
Rhode Island had the second-highest funding ($39,100 per mile) despite the worst highway conditions. Meanwhile, Kansas had the least amount of funding – $2,800 per mile – but the best-rated highways.
Nevertheless, the discrepancies in funding likely have to do with the quality of the roads, meaning states that need more repairs might get more funding. Hawaii, Rhode Island, Alaska, New Jersey, Delaware, and Connecticut had the most funding per mile of road, while Kansas, North Dakota, Nebraska, South Dakota, and Iowa had the least funding per mile.
Fortunately, dangerous roads don’t always correlate to bad drivers. A recent study that ranks the states with the best and worst drivers found New Jersey to have the fourth-best drivers despite having some of the worst road conditions in the entire country.
How Funding Affects Road Conditions
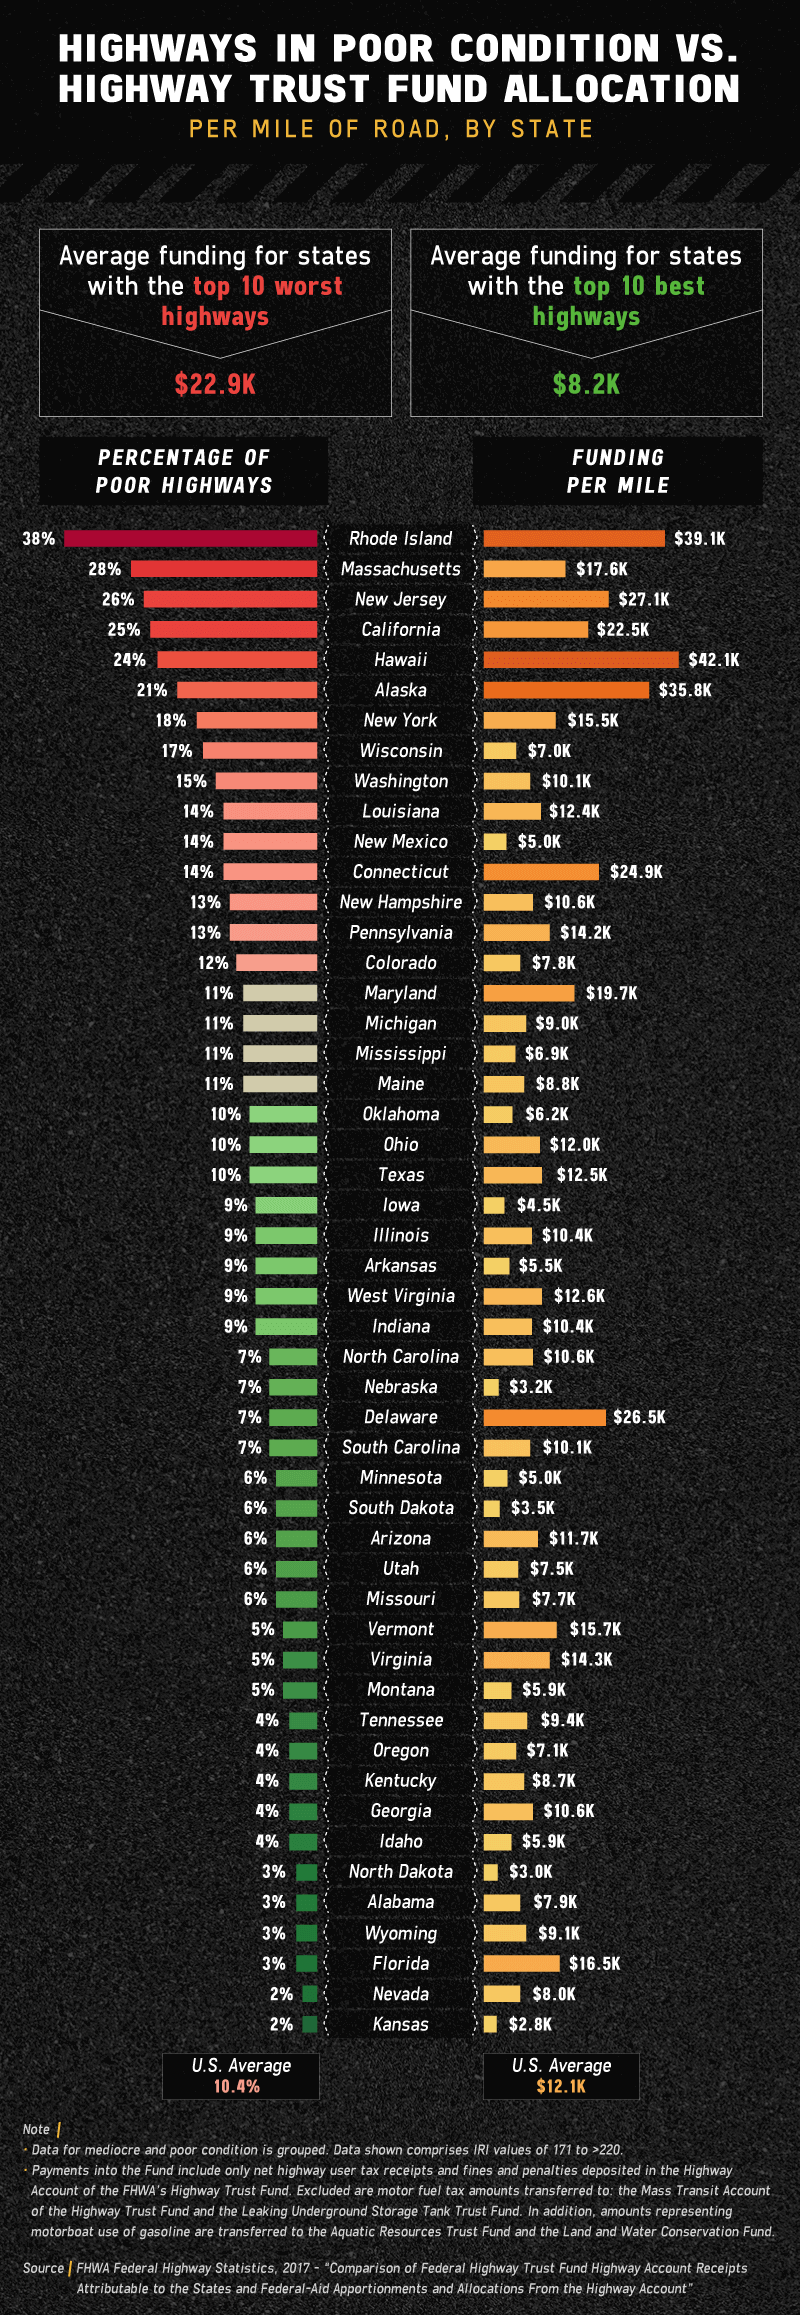
How do highway conditions stack up to their funding? According to our analysis, it really depends on the region. Rhode Island, for example, had the worst highways despite having the second-highest funding per mile. Fortunately, Rhode Island is still listed often in the best drivers rankings even with the worst highways in the country.
Part of the reason might be the strict child restraint laws in Rhode Island, which could cost a driver $85 if they haven’t safely and securely sat their children to reduce the chances of them dying if there were to be an accident.
Meanwhile, Kansas had the best-rated highways and the least funding per mile. These relationships do potentially make sense since funding might be dependent on the needs of the highways – in other words, Rhode Island’s highways are bad, so it needs more funding to fix them.
However, some states don’t fit this trend. Connecticut, for example, had a fairly average number of highways in poor condition at 14%. Nevertheless, the state had an unusually high amount of funding at $24,900 per mile.
Meanwhile, Massachusetts had the second-worst highways and not a lot of funding to work with — only $17,600 per mile. If you get in an accident on one of these highways, you need to make sure you have at least the minimum requirement for auto insurance in Massachusetts.
This can protect you financially for paying out thousands of dollars and possible court fines and jail time.
Free Auto Insurance Comparison
Enter your ZIP code below to view companies that have cheap auto insurance rates.
Secured with SHA-256 Encryption
How Bad Bridges Lead to Fatal Accidents
Recent news shows that poorly built bridges in a state of neglect or disrepair can have dire consequences. The Miami Herald reported that in 2018, a 174-foot-long pedestrian bridge with compromised structural integrity and significant cracks collapsed in Miami and killed six people.
The incident prompted many to call for better safety standards and monitoring, but many bridges are still used despite their less-than-ideal conditions.
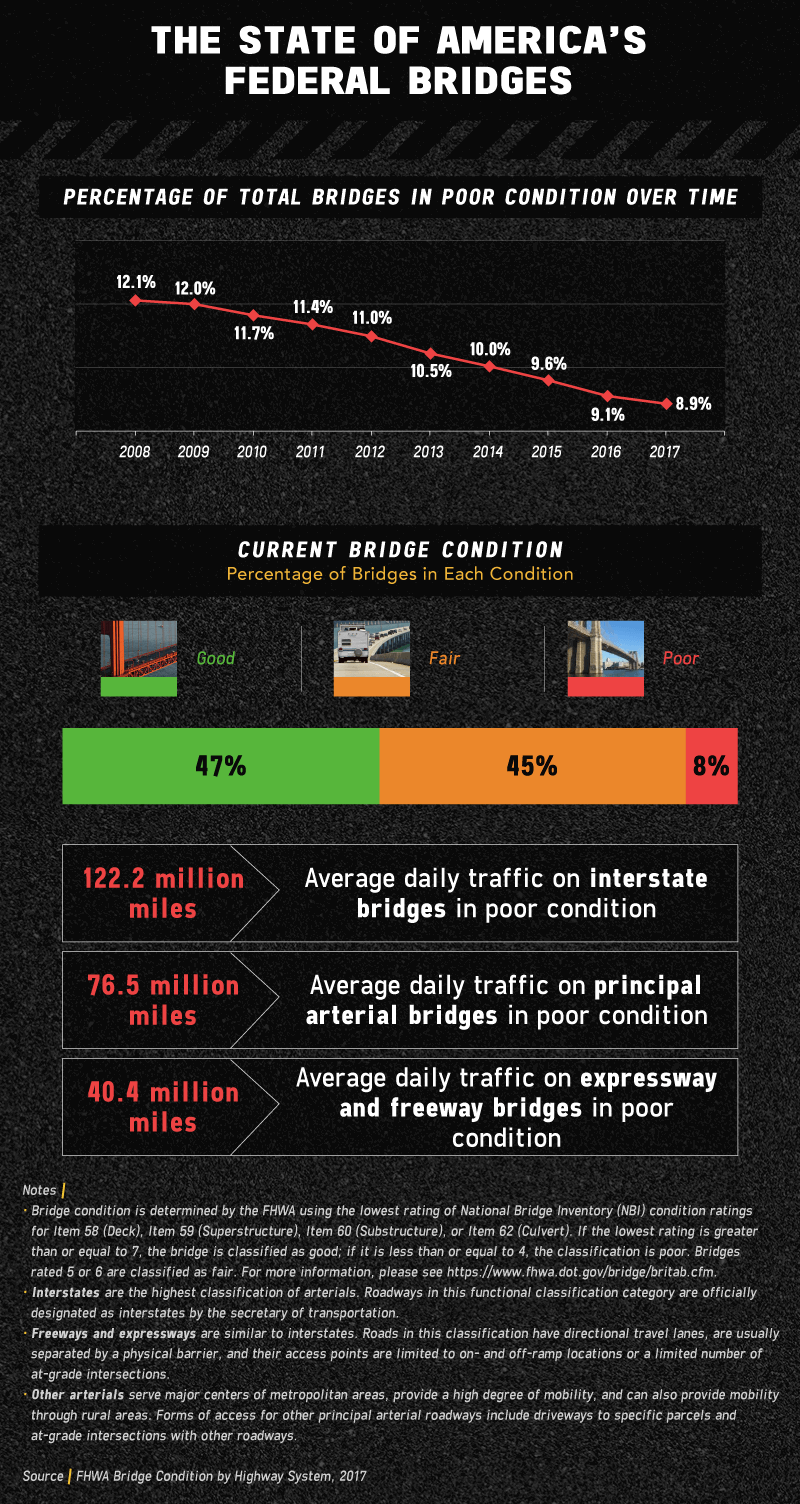
Nearly 9% of bridges in the U.S. were in poor condition in 2017. In fact, Americans drive about 122.2 million miles on interstate bridges in poor condition daily, along with 76.5 million miles on principal arterial bridges in poor condition and 40.4 million miles on expressway and freeway bridges in poor condition.
However, there is a silver lining: The overall percentage of bridges in poor condition has gradually dropped in the last decade. Around 12% of bridges were in bad shape in 2007, for example, compared to 8.9% in 2017.
Federal Bridges’ Condition by State
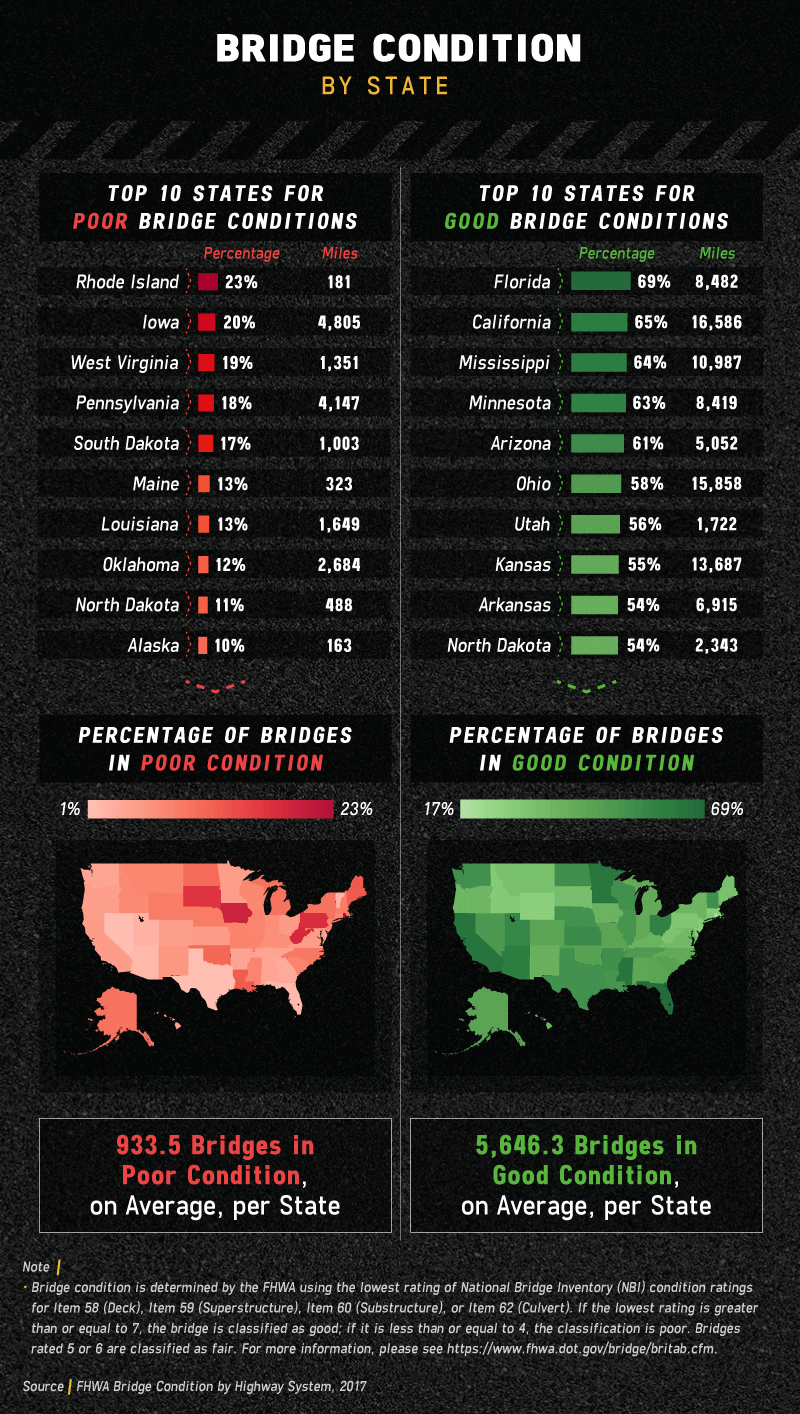
We have bad news for people with gephyrophobia – the fear of bridges. Our analysis of government data suggests that the average state had 933.5 bridges in poor condition. Rhode Island had the largest portion of bridges in a poor state at 23%, followed by Iowa, West Virginia, Pennsylvania, and South Dakota.
Even so, several states – particularly in the South and Midwest – stood out for good bridge conditions. Sixty-nine percent of bridges in Florida, for example, were rated as good, followed by California, Mississippi, Minnesota, and Arizona, all of which had at least 60% of bridges in good shape. On average, each state had 5,646.3 bridges in good condition. In other words, the odds of crossing a good-quality bridge are in our favor.
Protect Yourself with Auto Insurance
The U.S. has plenty of room for improvement when it comes to roads, bridges, and highways. In the 2017 Infrastructure Report Card, American bridges received a C+, while American roads received a D rating. We parsed through data from the Federal Highway Administration (FHWA) to further identify those weak spots and to see how infrastructure conditions could affect us depending on where we live.
While we can’t always control the roads we drive on, we can take action to protect ourselves. To learn more about how you can safeguard yourself and your family with affordable, quality insurance, visit Autoinsurance.org. Our team can compare quotes from the top auto insurance companies to help you save and achieve true peace of mind.
Free Auto Insurance Comparison
Enter your ZIP code below to view companies that have cheap auto insurance rates.
Secured with SHA-256 Encryption
Methodology: Determining Highway and Bridge Conditions
For this project, we used data from the Federal Highway Administration (FHWA). To examine road conditions and funding from the FHWA’s Highway Trust Fund, we used data from the FHWA’s Federal Highway Statistics, 2017. For data on the condition of U.S. bridges, we used the dataset Bridge Condition by Highway System 2017, which is included in the FHWA’s National Bridge Inventory Report.
To show year-over-year data for bridge condition, we used the FHWA’s Bridge Condition by Functional Classification dataset from 2000 to 2018. Because the most recent Highway Statistics Series report shows data for 2017, we excluded 2018 data from the bridge conditions.
Only U.S. states are included in our analysis; Washington, D.C., and outlying areas are not included. No statistical testing was performed.
Fair Use Statement
Do you want to share these findings on the state of America’s roads and bridges? The graphics and information found on this website are available for non-commercial reuse. Feel free to share them as much as you’d like across the web and on social media, but please make sure to link back to this page. Thank you!
With all this information, are you ready to compare auto insurance quotes? Bad highways and bridges can sometimes lead to higher auto insurance rates. To find the best rates, even if you live in an area with poor bridges and highways, just enter your ZIP code into our online quote generator in the box below. We want to make sure you get the best deal possible while being protected from financial damage.

Frequently Asked Questions
How bad is the United States’ infrastructure?
U.S. infrastructure is bad with as much as 30 percent of urban roads and about 15 percent of rural roads rated as poor. In many cases, lack of funding is a major issue in improving the infrastructure in the U.S. with some saying the U.S. needs $4 or more trillion to fix them before they deteriorate worse.
What are three different types of infrastructure?
If infrastructure was categorized and organized into groups, three different types might be travel-oriented (bridges, highways, and mass transit, for instance), waste-water treatment and hazardous waste removal, and distribution of power to cities or communities throughout the United States.
Which US city has the best infrastructure?
In terms of federal highways and bridges, we saw that Kansas had the most highways in good condition while Florida had the best bridges in good condition. The US city with the literal best infrastructure is tough to judge as there are so many different factors that make up the term “infrastructure.”
Which states have the best infrastructure?
In numerous reports, the states with the best infrastructure are spread out across three regions of the country: the West, the Midwest, and the Northeast. Generally, these tend to be smaller states in terms of population with Connecticut and Delaware in many top 10 rankings.
Which country has the best infrastructure?
According to Statista, Singapore is the country in the world with the best infrastructure. Its ranking includes factors like freight train infrastructure, road connectivity, and exposure to unsafe drinking water.
How does poor infrastructure affect the average American citizen?
Poor road infrastructure affects the average American citizen by increasing the wear and tear on cars, which requires repairs, causing accidents, the cost of which may affect the average American citizen more than the wealthy, and extending travel time.
What are the two types of infrastructure?
The two very broad categories of infrastructure are social infrastructure and economic infrastructure. Social infrastructure includes schools, medical hospitals, and housing. Economic infrastructure includes roads, mass transit, and even telecommunication systems.
What qualifies as infrastructure?
A definition of infrastructure might be the basic physical systems in a region, state, or country that those areas rely on for day-to-day tasks. This includes power systems, telecommunications systems, wastewater treatment facilities, roads, and more.
How can the US improve its infrastructure?
Improving infrastructure in the US requires significant funding and investment in repairs, maintenance, and expansion of roads, bridges, public transportation, and other critical systems.
Free Auto Insurance Comparison
Enter your ZIP code below to view companies that have cheap auto insurance rates.
Secured with SHA-256 Encryption
Justin Wright
Licensed Insurance Agent
Justin Wright has been a licensed insurance broker for over 9 years. After graduating from Southeastern Seminary with a Masters in Philosophy, Justin started his career as a professor, teaching Philosophy and Ethics. Later, Justin obtained both his Property & Casualty license and his Life and Health license and began working for State Farm and Allstate. In 2020, Justin began working as an i...
Editorial Guidelines: We are a free online resource for anyone interested in learning more about auto insurance. Our goal is to be an objective, third-party resource for everything auto insurance related. We update our site regularly, and all content is reviewed by auto insurance experts.


